
Sure, you are running continuous integration with loads of tests, at least every night. But what if a build or test fails? How long does it take your team to get back into ready-to-release mode?
Enter the red and green lights. Red goes on when a build or test fails. Red gets the boss out if his office. Red is bad. Green is good.
A great addition is to use that hippie-style lava lamp - if your energy bill can take it. If it goes on, the coders need to implement a fix, get it into version control, and let the CI build and test it before the lava gets all hot and bubbly. There is even a lava lamp Jenkins plugin that includes all necessary circuitry.
Some even go all out and install rocket launchers that use “git blame” to shoot rockets at the poor schmuck that checked in the bad code until he or she fixes it. You can download the “eXtreme Feedback” Jenkins plugin to win your own coding battles.
Now here is a twist:
Why not install that same red and green light at your customer or partner?
Total transparency and commitment in true agile style. The customer knows you’re not ready to deliver the code when the light is red.
The lamp or rocket launcher has one big missing feature though. If the light is green, how do you know it’s not turning red on you the moment you want to release? The only way to get faith in quality is by looking at the past. Has the light been green for more than 5 consecutive days? Yesterday’s weather is always a good indicator for today’s.
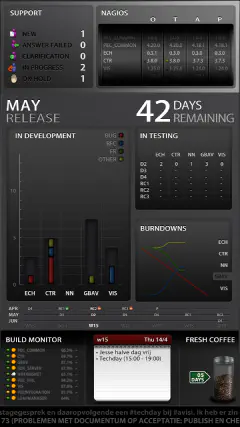
Enter the hotboard or “wallboard” or “information radiator”. Hang a big TV on the wall in the hall so every employee, partner, investor, or customer immediately knows the status of your product.
What’s on a typical hotboard?
Atlassian has some great hotboard examples with all these elements from their Ultimate Wallboard Contest in 2010.
So let’s look at other technologies out there. The basics still rule: HTML5, jQuery, CSS3 for the visualization, and something custom to get the data. Python, Java, Apache Wicket, etc. Look at these beauties:
To get started quickly, have a look at these hotboard frameworks:
Hotboard fatigue a.k.a wallboard blindness is a less-known disease that occurs in professional development teams that have a great hotboard but over time get so used to it that nobody looks at the board anymore.
A very simple remedy that fits nicely in agile is to assign a “watch”. Every morning before the daily stand-up, one developer checks the status of the hotboard and digs a bit deeper in the red flags, if any. She or he then reports the status at the stand-up and remains responsible for these issues to be removed as soon as possible by the team. Often that means the watch assigns developers to issues already during the stand up. This system also does magic if you run a more extensive test suite nightly and need someone to check the results the next morning.
The watch has this responsibility for a full development iteration. Then it rotates. This ensures every developer not only gets a clear quality focus, but also learns to help out the watch as much as possible. Just to make sure that when their time comes, the job will be easy.
How do you keep your development honest? Please share your hotboard best practices!

About Martijn Rutten
Fractional CTO & technology entrepreneur with a long history in challenging software projects. Former CTO of scale-up Insify, changing the insurance space for SMEs. Former CTO of fintech scale-up Othera, deep in the world of securitized digital assets. Coached many tech startups and corporate innovation teams at HighTechXL. Co-founded Vector Fabrics on parallelization of embedded software. PhD in hardware/software co-design at Philips Research & NXP Semiconductors. More about me.
Related Posts

